THE COMMAND
CONSOLE.
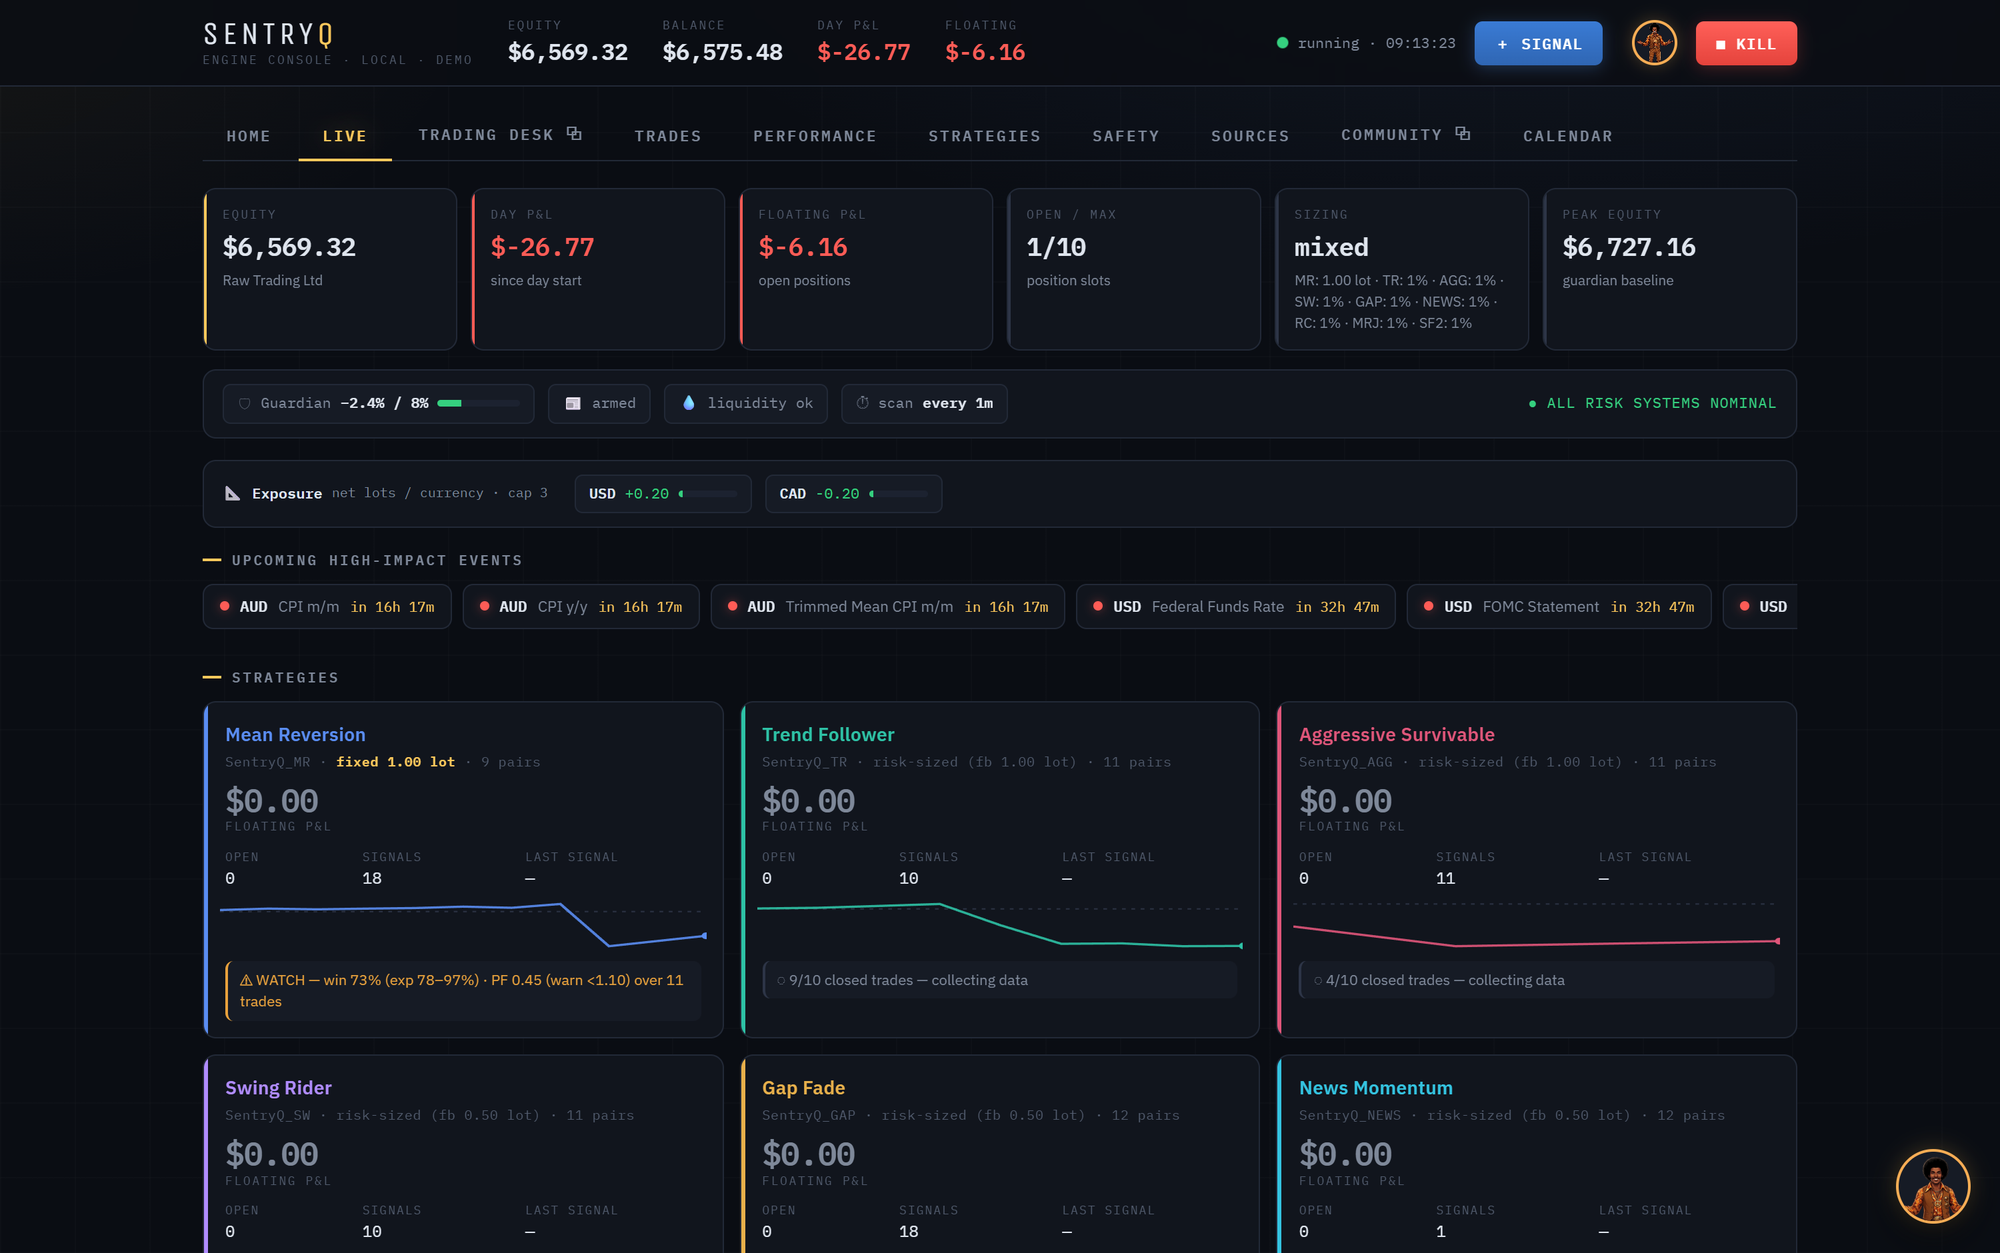
This is where the engine lives and where you command it. Not a web portal reading a database somewhere — a local console talking to a trading engine on your own machine. Everything below is the real interface, rendered with a live engine's data.
EVERYTHING THE ENGINE
KNOWS, ON ONE SCREEN.
The tab bar stays pinned under your equity header as you scroll, so switching view never means scrolling back up first.

| Row | What it shows you |
|---|---|
| KPI tiles | Equity and broker, day P&L since session start, floating P&L across open trades, open/max position slots, your risk-per-trade setting, and the peak-equity figure the Equity Guardian measures drawdown against. |
| The risk rail | Live guard status: Guardian drawdown against its limit with a meter, News Guard armed or active, liquidity/spread state, rollover and weekend windows, margin condition, and any drawdown throttle currently applied. It ends with a standing verdict — "ALL RISK SYSTEMS NOMINAL" — or a halt message with the reason. |
| Exposure row | Net lots held in every currency you're exposed to, each with a meter against your per-currency cap. This is the row that catches four "different" trades that are secretly one euro bet. |
| Strategy cards | One per live strategy: floating P&L, open positions, lifetime signal count, last signal with time, a sparkline of recent closed trades, and a health verdict. |
| Scanned pairs | Per-strategy tables of every pair being watched — bid/ask, trend state, the strategy's own indicator values, ATR, and how close the pair is to triggering. |
| Positions & orders | Open positions with entry, current, stop, pips, net P&L and the strategy label that opened them; resting orders with target, stop distance and expiry. |
THE CONSOLE TELLS YOU
WHEN IT'S DRIFTING.
Every shipped strategy has a validated envelope — the win rate and expectancy it produced across four years of out-of-sample data. The engine tracks the live rolling result against that envelope and puts the verdict on the card.
"✓ on track — win rate 58.0% vs 55.4% expected." That's a strategy behaving. When live results fall outside the band, it changes to WATCH, then DEGRADED — with the actual numbers, not a vague warning.
Most trading software will happily let a strategy quietly stop working. Ours is built to say so out loud, early, while you still have the option to turn it off. It's the same instinct as publishing our failed research: you can only trust a system that's willing to report against itself.
WHAT EVERY STRATEGY
IS LOOKING AT,
RIGHT NOW.
One tab per enabled strategy, each showing every pair it follows with live bid and ask, its read on the trend, and how close it currently is to firing. Click any row to open that pair with that strategy's own view.

Until v0.9.166 this list was hard-coded to the strategies that existed when it was written, so four of them — Aggressive Survivable, Reversal Capture, Stretch Fade and the since-retired Momentum Rejoin — were scanning away with no tab to show for it. Tabs are now built from whatever the engine reports as running, which means the next strategy appears on its own without anyone remembering to add it.
ITS OWN WINDOW.
ITS OWN MONITOR.
Renamed from Live Charts in v0.9.156, because it stopped being a chart and became somewhere you work. It opens as a separate window — park it on a second screen and the console keeps the first.

Twenty-nine indicators
Trend, volatility, levels and eight oscillators, each with its periods editable inline and its own sub-pane where it needs one.
Six drawing tools
Trend lines, horizontal levels, zones, Fibonacci, freehand and text notes — every point anchored to a bar time and a price rather than a pixel.
Measurement that means something
Shift-drag for pips, percent, bars and elapsed time at once. Re-projected every frame, so zooming never changes the answer.
Feedback on your own analysis
Your guide reads the indicators and lines you actually have on screen and critiques them — where they're well supported, where they're thin, what they ignore. Never whether to trade.
A full order ticket
BUY, SELL and Place order in the corner. Sized from your balance, checked against all twenty-six guards, managed after entry like any other position.
Share the view
Send this chart, an open position, or the ticket you're filling in — to someone you've connected with, without placing anything.
Chart chat, and live markup
A fifth tab holds a conversation about the pair you're on. Turn on live markup and your lines appear on the other members' charts as you draw them — rebuilt on their own bars.
Sized how you like it
Drag the divider to trade chart height for panel height, and pop the conversation into its own window for a second monitor.
Every part of it, in detail: inside the Trading Desk →
WHAT TRADED, AND
WHAT IT REFUSED.
At the end of each session the engine writes you a plain-English account of the day. Not a P&L dump — an explanation, including the opportunities it deliberately passed up. Since v0.9.156 it lives in the Market Analysis window, alongside Positioning, the Report and FX Options: these are things you read, and the console is for acting.

Automated trading fails people when it becomes a black box that occasionally changes your balance. The day summary is our answer: every evening, in ordinary English, the engine accounts for itself — what it did, why it did it, and which trades your own safety settings cost you.
TWENTY-SIX GUARDS,
ALL VISIBLE.

Every entry a guard refused is replayed against real prices with the strategy's own stop, and the result is shown for the last 30 days: which guard blocked it, how many times, and what those trades would have made or lost. In the panel above, refused entries would have lost 28 pips net — so the guards kept the account out of trouble. Blocks that cost you profit are listed too, with a positive number. A protection system that only ever reports its wins is marketing, not measurement.
Guards are not decoration — they are the reason the platform exists. The capital protection page walks through all twenty-six in detail: what each one watches, what it does when triggered, and the specific failure mode it was built to prevent.
THE LEADERBOARD,
BUILT IN.
The console carries the full signal-source directory. Search public Telegram channels, add one, and SentryQ joins it, imports its recent history, scores every signal against real market prices and subscribes you.
The Leaderboard tab ranks sources by expectancy with a complete report card — sample size, win rate, average R and profit factor — and honest provenance on every row separating provider-published history from signals we recorded live.
Signals from the sources you follow then arrive in your inbox here, on your phone, and as sized previews in Telegram — each one already priced against your account and checked against your guards.

YOUR OWN TRADES,
PROFESSIONALLY SIZED.

A manual trade in SentryQ is not an escape hatch from the risk system. It goes through the same twenty-six guards as an automated one, gets the same labelling, appears in the same history and day summary, and counts toward the same exposure caps. The engine doesn't care whose idea a trade was — it cares what it does to your account.
TALK TO PEOPLE
YOU'VE CONNECTED WITH.
Also its own window, so a conversation sits beside the console rather than replacing what you were watching. Direct messages, small groups, and two structured cards: a shared chart and a shared trade.

A shared trade is entry, stop and up to three targets — numbers only. Open it and it is sized from your balance at your risk setting and put through your guards, then waits for you to confirm. There is no copy-trading and there will not be: auto-executing someone else's trades is regulated portfolio management, and it moves the risk away from the person making the decision. The full design, and what we deliberately left out →
MARKET CONTEXT,
ON YOUR SECOND SCREEN.
Traders kept asking the same question when a move went against them: what is actually going on with the dollar right now? Market Analysis answers it without leaving SentryQ — and it opens as a separate window, so it can live on one monitor while the dashboard keeps showing your trades on another.

What's scheduled
The economic calendar for that currency: what's coming, when, its impact rating and the forecast — plus what has already printed in the last 48 hours.
Who's positioned where
CFTC Commitments of Traders: net speculative position, the week-over-week change, and what share of that book is long. A crowded trade is a fact worth knowing before you join it.
Straight from the source
Headlines from the Fed, ECB, Bank of England, Bank of Japan, RBA, Bank of Canada and SNB — the institutions that actually move these currencies, not commentary about them.
Your book
Your exposure in that currency against your cap, whether positioning is crowded, when the next high-impact event trips your News Guard, and where equity sits against the Equity Guardian limit.
Anyone can embed a news feed. What no one else can show you is how the news lands on the account you are actually running — because nobody else has both halves. SentryQ already knows your exposure, your positions, your caps and your guards, so the window can say: "you hold 0.85 net lots of USD against a 1.50 cap; speculators are 63% long; the next high-impact release is in two hours and your News Guard will suspend entries around it." That is four separate screens' worth of work, in one sentence.
Every headline shows its title, its source and its time, and opens at the publisher. SentryQ stores the headline and the link — never the article. These are official public communications, cited properly, and the people who wrote them get the visit. It's the same principle behind our refusal to rebroadcast paid signal groups.
EVERY HEADLINE.
ONE FEED.
Traders told us the Macro view answered "what's happening to the dollar" but buried the flow. So the window now has master tabs, and Wire is the whole stream: every headline from every source, newest first.
Filter by currency or by category, search the text, and let the important stuff find you — anything touching a currency you actually hold is marked in your book and given a gold edge. Categories are colour-coded, so a rate decision never looks like a routine statistics upload.
Twelve sources, up from seven. The seven central banks — Fed, ECB, Bank of England, Bank of Japan, RBA, Bank of Canada, SNB — now sit alongside the US Census Bureau, the ONS, Bank of Japan statistics, HM Treasury and the US Energy Information Administration.
Click any headline and the panel tells you what it means for your account: which of your pairs carry that currency, what you have on in them, your exposure against your cap, whether the News Guard is standing in the way, and when the next scheduled release lands.

THE MEASUREMENTS
BEHIND THE GUARDS.
Currency strength over 24 hours: each currency's average move across every watched pair it appears in, sign-adjusted. Volatility as a percentile of each pair's own last 30 days, so "8.2 pips" becomes "quiet for this pair, 34th percentile". Spread expressed as a share of that pair's hourly range — the honest way to compare entry cost across pairs that move at different speeds.
And a correlation heat map across your watched pairs. This is the measurement the Portfolio Exposure Guard already acts on, finally made visible: pairs near +1 move together, which in risk terms makes them closer to one position than two. It's the difference between believing you hold three trades and knowing you hold one.
All of it is computed from your broker's own price history — no third-party data feed, nothing licensed, nothing that can quietly go stale or start costing money.
A session clock rounds it off: Tokyo, London and New York, which are open, and how long until that changes.

TELLS YOU WHAT
IT MEASURED.
Five thresholds you can switch on: a high-impact release due on a currency you hold, volatility at the top of a pair's own range, a spread that's wide against that range, one currency moving against all its majors at once, and two pairs you hold that have been moving as one.
Every alert states the number that tripped it and your own exposure. A real one reads: "GBP is lower against all 3 of its watched pairs over 24 hours, −0.61% on average. You are exposed to GBP." That's a measurement and a fact about your account. It is not a view, and it is not a nudge to trade.
That last currency rule deserves a note. "The dollar is being sold" is a feeling; one currency moving the same direction against everything at once is a thing you can count. We ship the second and leave the first to you.

OTHER PEOPLE'S
ANALYSIS, CLEARLY THEIRS.
Thirteen live news channels, embedded from each broadcaster's own YouTube channel: Bloomberg Television, CNBC, Yahoo Finance, Schwab Network, plus Sky News, DW, France 24, Euronews, CBS, ABC News Live, LiveNOW from FOX, CNA Insider and TRT World.
Any stream pops out into its own window — park it on a second monitor, tick "keep on top", close it whenever. It keeps playing while you work through the rest of the app, and it remembers where you left it.
Nine podcasts too, refreshed every half hour: Odd Lots, Bloomberg Surveillance, the FT News Briefing and The Economics Show, WSJ Minute Briefing, CNBC's Squawk Pod, Macro Musings, Forward Guidance and Marketplace. Episodes stream from each publisher's own feed — we never host, alter or re-encode their audio, so their advertising reaches you and their numbers stay intact, exactly as with the headlines in the Wire.
This tab sits deliberately apart from Macro, Wire and Board. Those carry only what SentryQ measured. This carries opinion — other people's, attributed to them. Both are useful; conflating them would not be.


WHAT ACTUALLY
HAPPENED LAST TIME.
Pick a pair and a recurring release — CPI, Jobless Claims, a rate decision — and see how that pair really moved in the 15, 30 and 60 minutes after every past occurrence.
The median move, the typical size regardless of direction, the 10th-to-90th percentile spread, how often it went up, and how often the first fifteen minutes' direction was still intact an hour later. Then every individual release listed: the actual figure, the forecast that preceded it, the surprise between them, and the move that followed.
It tells you how much it actually measured. "10 of 34 known releases fell inside the price history we hold; 24 were older than it reaches." A study built on ten releases is worth less than one built on thirty, and you should never have to guess which you're looking at.
This exists because the economic calendar now comes from MetaTrader, which carries years of releases with both the actual figure and the forecast. The web feeds everyone else uses carry this week only, and no actual value at all — which is why nobody else can show you this.

It gets better on its own
A broker will hand over a few months of minute-level history in one request; a monthly release like CPI needs years before the sample means much. So engines contribute their price history and the platform keeps the union of it — what one engine gathers, every user's studies draw on. The record deepens by itself, which means the answer you get to the same question in six months will rest on more evidence than the one you get today. Prices only: no positions, no account, nothing identifying.
Why the alerts stay in the window
They appear in the Analysis window only — not pushed to your phone, your email or Telegram, and every trigger starts switched off. That's deliberate. A page you chose to open reads as reference; a notification arriving while you're in a meeting reads as a prompt to act. SentryQ doesn't prompt you to act. Trade alerts about your own positions — opens, closes, guard events — are a different thing, and those still reach you wherever you are.
WHAT YOU ACTUALLY
INSTALL.
No servers to configure, no API keys to paste into a text file, no Docker. It's a Windows application with an installer and automatic updates.
| Item | Detail |
|---|---|
| Platform | Windows 10/11 desktop application. Runs equally well on a cheap always-on VPS if you'd rather not leave a PC on — we'll help you set that up on the Elite plan. |
| Brokers | Any broker offering cTrader or MetaTrader 5 — IC Markets, Pepperstone, FxPro and dozens more. MT5 requires a hedging-type account (the retail default); the app checks and tells you if yours isn't. |
| Connection | cTrader via its own OAuth consent page; MT5 via a direct local link to the terminal you're already logged into. Your broker password is never entered into SentryQ. |
| Updates | Automatic and incremental. After each update a short "what's new" note tells you exactly what changed — no silent behaviour changes to software that trades your money. |
| Trial | 14 days on a demo account, no card required. Trials and the initial release run demo-only, so you can watch it trade with nothing at stake. |
| Data & privacy | The engine runs locally. Your account snapshot is relayed to your SentryQ account so the mobile app can read it; broker credentials never leave your machine. |