A CHART THAT
ACTUALLY MOVES.
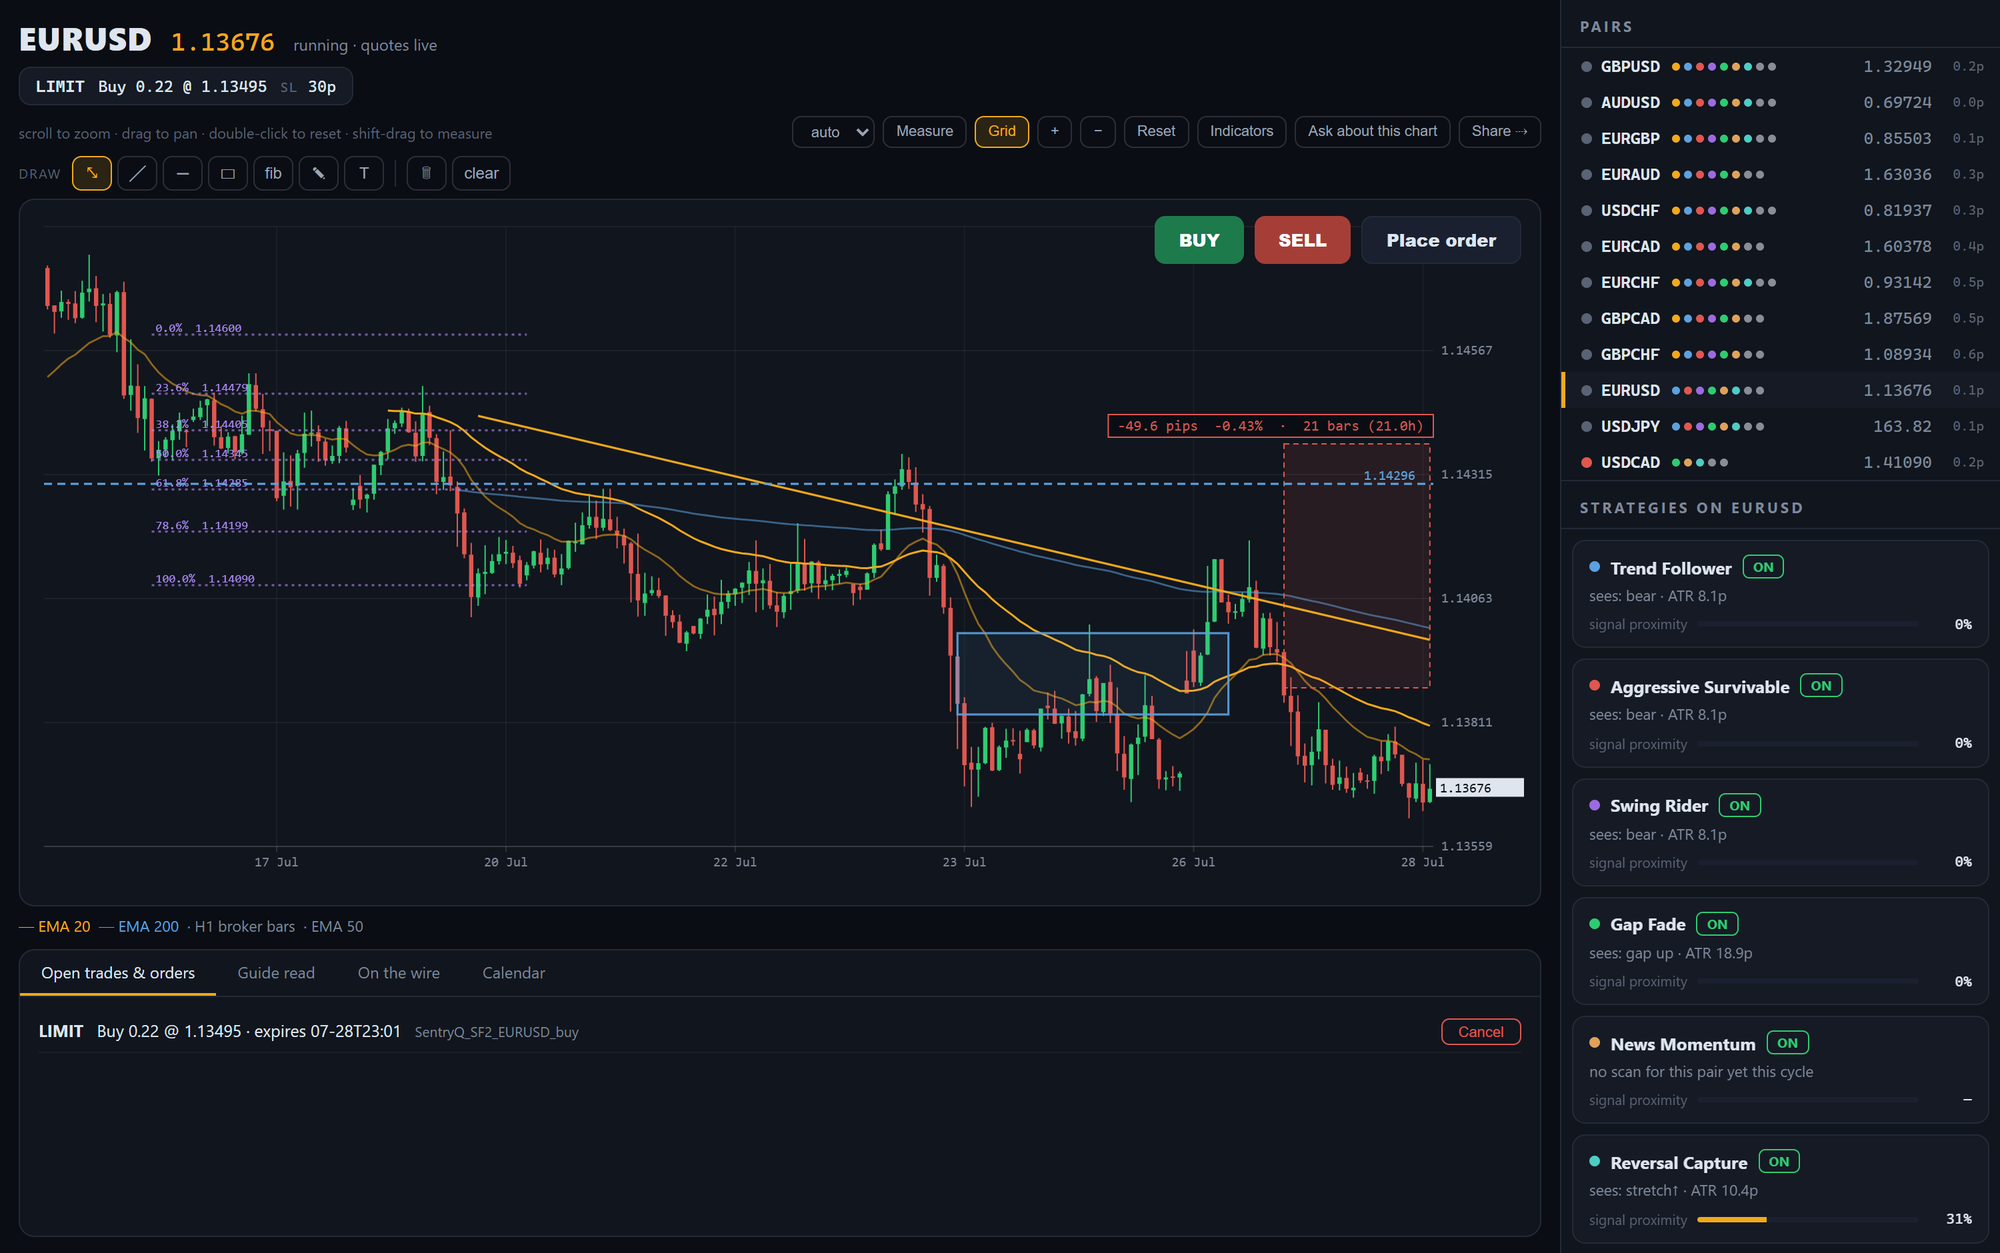
The Trading Desk opens in its own window, so it can live on a second monitor while the console runs on the first. Prices refresh every two seconds. The current candle breathes between bar fetches. Twenty-nine indicators and six drawing tools sit on top, a full order ticket sits in the corner, and your guide will read back the analysis you have drawn — without ever telling you to trade it.
TWO SECONDS,
NOT THIRTY.
Until July 2026 the desk polled prices every twenty seconds and bars every sixty. On a fast-moving pair that meant a number on screen could be over half a minute old — and it looked frozen, because it was. We rebuilt the whole chain.

| What | How often | Why that number |
|---|---|---|
| Price on the chart and in the pairs rail | Every 2 seconds | Fast enough to feel live without hammering your broker for data you aren't looking at |
| The candle you're inside | Continuous | The forming bar's high, low and close track the live bid between bar fetches, so it grows as you watch instead of jumping |
| Completed bars | Every 25 seconds | A closed bar cannot change. Re-downloading history faster buys nothing. |
| The engine's own trade-management tick | ~4 seconds | Account, positions, quotes, guards and stop management — the things that move money |
| The heavier management pass | Every 15 seconds | Resting orders, observers, the live-book stress test and state saving |
The engine measures how long your broker actually takes to answer and stretches its own tick to roughly two and a half times that, never spending more than about 40% of a cycle waiting. A healthy link runs at four seconds; a struggling one backs off toward fifteen rather than queueing requests behind each other. If something throws, the next tick waits a full pass instead of retrying in a tight loop.
On MetaTrader 5 we made it genuinely cheaper. The desktop bridge gained a single call that returns every quote you need at once instead of one round trip per pair. Measured against a live terminal: 145.6ms down to 15.5ms for twelve pairs — 9.4× faster, and one lock acquisition instead of twelve. cTrader's API has no bulk equivalent, so there a fast tick fetches the pairs you actually hold plus the symbol on your chart, and fills the rest of the rail from cache.
TWENTY-NINE OF THEM.
ALL YOURS.
Pick from five families. Overlays draw on the price pane, oscillators get their own sub-pane below it with the right scale and guide lines. Every parameter is editable inline, your set is remembered across pairs and restarts, and everything is computed on your machine from your broker's bars — nothing is fetched from us.

| Family | Indicators | Where it draws |
|---|---|---|
| Trend · 9 | Simple MA · Exponential MA · Triangular MA · Time Series MA · Supertrend · Ichimoku Cloud · Parabolic SAR · ADX · Relative to another pair | Price pane; ADX and the relative line in the sub-pane |
| Volatility · 5 | Bollinger Bands · Keltner Channels · Average True Range · ATR percentile · Daily range used | Bands on price; the rest in the sub-pane |
| Levels · 5 | Highest / Lowest · Support / Resistance · Pivot Points (daily) · Economic events · FX sessions | On the price pane |
| Oscillator · 8 | RSI · MACD Crossover · MACD Histogram · Momentum · Price ROC · Price Oscillator · Stochastic · Ultimate Oscillator | Sub-pane, with 30/70-style guides and a zero line where the indicator has one |
| Cost · 2 | Carry cost if held · Spread (this session) | Sub-pane, from your broker's own swap table and quotes |
It finds swing pivots — highs with lower highs either side, lows with higher lows — and draws the levels that repeat. That is a heuristic, not arithmetic: change the lookback and the levels change. Every other indicator on the list computes one answer from your bars. This one makes a judgement, so the picker says so rather than letting it sit among the others looking equally certain.
SIX CLOCKS.
ONE SET-UP.
M5, M15, M30, H1, H4 and D1, plus auto — which follows whatever timeframe the strategies on that pair are actually reading. Switch and every overlay is recomputed on the new bars; nothing is stretched or interpolated.
If your broker can't serve the timeframe you asked for natively, the desk says which one it fell back to rather than quietly showing you something else.

DRAW IT, AND IT
STAYS PUT.
Six tools. Every point is stored against a bar time and a price — never a pixel. Zoom, pan, resize the window, switch monitors, come back tomorrow: the line is still on the same two candles it was drawn on.
| Tool | How it works |
|---|---|
| Trend line | Two clicks, rubber-banded between them. Grab it later with the cursor to move the whole line without redrawing it. |
| Horizontal level | One click. Extends across the full window and carries its price in the right-hand gutter. |
| Rectangle / zone | Two clicks for a shaded box — supply, demand, a range you're watching. |
| Fibonacci retracement | Two clicks across a leg; the standard levels are drawn and labelled with both the percentage and the actual price. |
| Freehand | Drag to sketch. Every point in the stroke is anchored, so the sketch survives a zoom instead of smearing. |
| Text note | A short label pinned to a price and a time — for the reason, not just the line. |
| Select / move | Click a drawing to pick it up. Delete removes the selected one, Esc cancels whatever you're mid-way through, and clear wipes the pair after asking. |
PIPS, PERCENT,
BARS AND HOURS.
Hold shift and drag — or press Measure — and the desk reads out the move between two points four ways at once: the distance in pips, the same move as a percentage, how many bars it took, and how long that actually was in hours or days.
It is the same anchoring as the drawing layer. The measurement is pinned to bar time and price, so it is re-projected every frame: zoom in and the box stays across the same two candles, showing the same number. A measurement pinned to pixels would quietly change its answer every time you scrolled, which makes it worse than no measurement at all.
And it travels. When you share a chart, the measurement goes with it — redrawn on the recipient's own bars, at the same prices, rather than arriving as a picture of your screen.

IT READS YOUR CHART.
IT WON'T TELL YOU
WHAT TO TRADE.
Press Ask about this chart and your guide is handed a description of what is actually on screen — the pair, the timeframe, the window, every indicator with its current values, and every line you have drawn, with the touch counts and slopes measured for it. It then comments on your analysis: where it is well supported, where it is thin, and what it appears to be ignoring.

What it will do
Describe what you've drawn in its own words, so you can check it read you correctly. Measure it — touches, slope, how far price sits from each line. Cross-check your lines against your indicators and say where they disagree. Name what your analysis leaves out. Ask you a question back.
What it will not do
Tell you to buy or sell. Suggest an entry, a stop or a target. Predict where price goes next. Rate the trade. The instruction it runs under forbids a verdict on whether to trade, and we test that boundary against the live model rather than trusting the prompt.
An agent that says "this looks like a good short" is giving investment advice, and we are a software company, not an adviser. An agent that says "your trend line has 21 touches, but your oscillator is mid-range — those two things are in tension" is doing something genuinely useful and entirely different: it is checking your work. The decision, and the responsibility for it, stays where it belongs.
It also refuses to guess. With nothing drawn and no indicator on, it tells you so rather than inventing an opinion about a bare chart — because at that point the only facts available are the pair and the timeframe.
YOUR TRADE. THE
ENGINE'S DISCIPLINE.
BUY, SELL and Place order sit in the top corner of the plot. A trade you type in by hand goes through exactly the same path as one a strategy generated — sized from your balance, checked against every guard, then managed afterwards.

Sized, not guessed
You give it a stop; it works out the lots from your balance and your risk percentage. If it cannot size a trade safely it refuses it — a trade we cannot size is a trade we do not take.
Every guard applies
All twenty-six protections run on a hand-typed trade too: exposure caps, spread, news windows, the open-risk budget, the loss tiers. Your own idea does not get a bypass.
Managed after entry
Breakeven moves, the profit protector and the weekend gap guard look after it from then on — the same machinery that looks after a strategy's positions.
Or it can adopt what you did elsewhere
Turn on Look after my own trades and positions you opened in your broker's own terminal are picked up and managed too, without SentryQ having placed them.
The ticket, the share panel and the order form all dismiss when you click outside them — a small thing that stops half-filled tickets sitting over your chart. Nothing is submitted on a stray click; the only way an order leaves is the button that says so.
SEND WHAT YOU'RE
LOOKING AT.
One button, three things you can send: this chart, an open position, or the ticket you're filling in — that last one without placing it.
A shared chart is not a screenshot. It carries the pair, the timeframe, the window your eyes were on, the indicators you had applied with their periods, every line you had drawn, and any measurement — all in bar time and price. When the person you sent it to opens it, their desk redraws your analysis on their broker's bars. They can then move your lines, change your periods, or clear the lot and keep their own view.
That distinction matters more than it sounds. A picture of someone's screen is an argument you cannot inspect. The same analysis rebuilt from your own data is something you can actually test.

THE TAB THAT
MATTERS IS THE ONE
THAT'S OPEN.
The bottom half of the desk opens on Open trades & orders every time, because that is the question you actually walk up to the screen with. Alongside it: your guide's read on the pair, the headlines touching it, and what's on the calendar for its currencies.
Open trades & orders
Every position and every resting order on the pair, with the strategy label that placed it, live P&L in pips and money, and a cancel button on the orders.
Guide read
A plain-language read on the pair in front of you — what the engine is seeing, and why it is or isn't interested right now.
On the wire
Headlines filtered to the two currencies in the pair, so the reason a candle looks odd is one glance away.
Calendar
What is scheduled for those currencies, with impact ratings — the releases the news guard will hold entries around.
Chart chat
A conversation about the pair in front of you, with the people you have connected with. Switch pair and the conversation switches with it.
Down the right: every pair the engine follows, with its live price, its spread, and a row of coloured dots showing which strategies are watching it. Click one and the chart follows. Below that, for the pair you're on, each enabled strategy shows what it currently sees and a signal proximity bar — how near it is to actually firing. It is the difference between "nothing is happening" and "something is about to".
A CONVERSATION
THAT BELONGS TO THE
CHART.
Not another inbox. Open a conversation on EURAUD, add one connection or several, and everything said there stays with that chart. Move to another pair and the tab shows that pair's conversation instead.

Scoped to the pair
Rooms are opened from a chart and carry its symbol, so the tab only ever shows the conversations about what you're looking at.
Pick people from a list
Search your connections by name or handle and tick the ones you want. People already in the room are shown as such, and it tells you who it added.
You can see who is in it
Members are listed above the messages at all times, with whoever started it marked. If it's still just you, it says so.
Nothing arrives silently
A count appears on the tab, and the conversation also shows in your Community window marked chart — so a message landing while the desk is closed is never lost.

DRAW A LINE.
THEY SEE IT
APPEAR.
Turn on Live markup and the analysis becomes shared. Every line, level, zone, Fibonacci and indicator you add shows up on the other members' charts as you make them — and theirs on yours, tagged with who drew what. Talk about it in the same panel while you do.

It is a shared layer, not a shared screen
Your lines are rebuilt on their broker's bars, because every drawing is anchored to a bar time and a price rather than a screen position. That means they can grab your line, move it, change your periods and test the idea against their own prices — which is the entire point, and the thing a screen share cannot do.
What that honestly costs
Two people on brokers whose prices differ by a pip will see a line a pip apart. We think that is the right trade — you are each looking at your own data, which is what you will actually trade against — but it is a real difference and we would rather say it than let you discover it.
| What travels | How |
|---|---|
| Trend lines, levels, zones, Fibonacci, freehand, notes | As the drawing itself — added, moved and deleted in step on every chart in the room |
| Indicators and their periods | As a set. Each chart then computes them from its own bars, so nobody is looking at someone else's numbers. |
| The timeframe | Change it and the room follows, so you are not discussing an H1 level while someone reads M15 |
| Who may draw | Everyone can read and talk. Drawing is a permission the person who opened the conversation grants. |
PUT THE CONVERSATION
ON THE OTHER SCREEN.
One button lifts the chat into its own window, so it can sit beside the desk — or on a second monitor — while you work. It stays fully live: messages, members and shared markup all keep working in the popped-out window.
And the panel under the chart is now yours to size. Drag the divider to give the conversation more room and the chart less, or the other way round. Double-click it to put it back. It remembers where you left it.

Someone who is not in a chart conversation cannot post to it or mark up its chart, and that is enforced in the data layer on every single message and every single drawing — not in the screen that draws them. It is the same check that governs direct messages and groups. Blocking someone hides their markup from your chart exactly as it hides their messages. How the rest of Community works →